I’m trying to replicate a drained triaxial compression test in PFC using rigid walls. The experimental loading was applied at a constant displacement rate of 0.1 mm/min, and the specimen height is 100 mm. Since the strain rate is defined as rate = velocity/height, this gives:
rate=(0.1 mm/minute) /(100 mm) =1.667×10⁻⁵ s−1
I want to make sure this translation is appropriate for use in PFC. Would applying this strain rate (1.667e-5 s⁻¹) accurately reflect the experimental conditions, or are there additional considerations I should be aware of when implementing it in the simulation?
I suggest that you use local damping with a damping coefficient of 0.7 to maintain quasistatic conditions during the test. If you do this, then your loading rate can be much larger than the loading rate in the physical test. This is explained in Section 5.4 Loading Rate in the material-modeling support memo that can be obtained from the link {Material-Modeling Support for PFC | US Minneapolis - Itasca Consulting Group, Inc.}
Is dt the timestep? And mostly the velocity we are providing is in m/s, right?
Also, I want to know how to determine the stresses in the shell elements?
I do not know to what document you refer to. Typically, the symbol dt is timestep. By default, in PFC, it has units of meters per second if you give properties in SI units. In FLAC3D, default units are meters per step. Getting stresses in shell elements can be visualized with Shell or Liner or Geogrid plot items as color contours. Also printed via structural shell list command and also via FISH. This is all explained properly in the manual in the Structural Elements section.
Greetings of the day
I have imported the STL file of a sand particle into PFC, and then, using rblock, I am preparing the specimen. However, the size of the rblock is large compared to the specimen size. Is there a way to reduce its size to fit the particle size distribution curve?
A few code lines I have attached
geometry import ‘1vol.stl’
rblock template create ‘Rblock1’…
from-geometry ‘1vol’ round relative 0.1
Hello Mujeeb, You create the rblocks to satisfy a given size distribution using the {rblock distribute} command (see snapshot).
There is a PFC3D example that performs an oedometer tests on balls, clumps, and rblocks. It can be downloaded from the link: ShareFile. See slides {8, 11, 14, 17} of file {otPkg.pptx}. The snapshot is from file makeRblocks.p3dat. And finally, you can contact Ayat Alassadi ayat.alasadi@utah.edu (who is my IEP student and is using the oedometer test package, and has imported realistic particle shapes as you are doing).
I will check the rblock distribute command and thank you for sharing the email of Ayat Alassadi
Hello sir
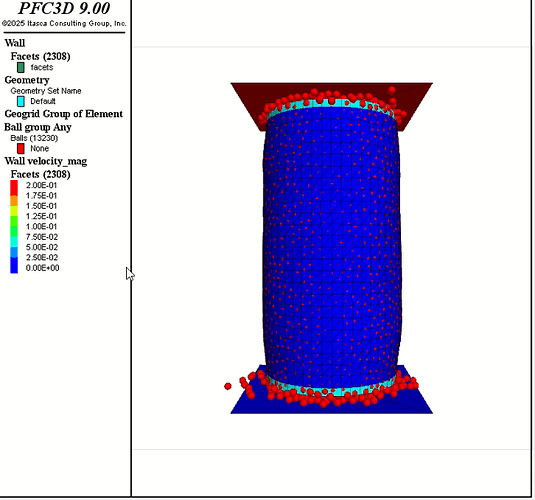
I am modeling a triaxial test using a membrane-based sleeve ( Sleeved Triaxial Test of a Bonded Material (FLAC3D) — Itasca Software 9.0 documentation ).. The specimen is generated with spherical balls, and the contact behavior is defined using the linear contact model. After preparation, I apply isotropic confinement with a ramp function until the target confining pressure of 100 kPa is reached.
I’m facing two issues:
-
Initial boundary response
During the very first increment of loading, the wall boundaries (at the top and bottom) move outward instead of applying compression. The sample briefly expands before the walls move inward. I have shared an image showing this effect. -
Volumetric strain computation
I calculate volumetric strain inside the sleeve using my custom code (attached), but during consolidation, the volumetric strain vs. time curve shows unrealistic and irregular fluctuations rather than a smooth compaction trend.
Could you please help me identify the cause and suggest how I can correct both the boundary movement and the volumetric strain calculation issues?
Step1_Sample.dat (10.9 KB)
Step2_Compact.dat (7.0 KB)


