Hello,
I am currently simulating a triaxial compression test on a rock specimen under different confinement pressures (uniaxial, 10 MPa, 20 MPa, and higher). The stress–strain curves and the associated FISH functions work as expected for the 10 MPa case. However, when I use the same parameters at higher confinement (e.g., 20 MPa), the stress–strain response does not produce the expected results.
To speed up the simulations, I adjusted the strain rate from 0.05 to 2. This modification worked well for the 10 MPa confinement, but for the 20 MPa case, the results still fail to converge to a reasonable curve, even with different strain-rate values.
I am using the Material Modeling Support Package and have attached the parameters I used as well as a figure showing the result of the 20 MPa test.
Here are the key parameter settings I applied:
fish define ctSetParams
; Set Compression-Test Parameters
ct_testType = 0 ; test-type code (0: confined, 1: unconfined, 2: uniaxial strain)
ct_Pc = 10.0e6
ct_Pc = 20.0e6
ct_eRate = 0.05
ct_eRate = 2
ct_loadCode = 0
ct_loadFac = 0.8
end
I would greatly appreciate any guidance on why the 20 MPa confinement test is not behaving as expected and whether additional adjustments are needed to the parameters for higher confinement levels.
Thank you for your support.
Best regards,
Alaa
Dear Alaa, If you are modeling a quasistatic test then you MUST apply a platen velocity that is slow enough to insure this condition and you should use local damping with a damping factor of 0.7. You model is being loaded extremely fast, and this is causing a dynamic response. This issue is discussed in the Material Modeling Support memo:
1 Like
Thank you so much! It worked!
Hi David,
Could please share this document with me, please alternatively on kabweeugie@yahoo.com
Thank you
Regards
Hi,
You can download it from here:
Alaa
1 Like
Hello David,
After it initially worked, I re-ran the simulation using both PFC Version 7 and 9. However, the initial portion of the stress-strain curve does not look correct (please see the attached figure). In some runs, I don’t obtain a stress-strain response at all.
I have spent more than a week trying to resolve this, but each time I re-run the simulation I obtain a different response, and none of them appear to be correct.
Do you have any idea what might be causing this issue?
Thanks in advance!
Dear Alaa [Please tell me what is your real name so that I can address you properly], The behavior is as expected. The matModSup package first applies a specified seating stress to the specimen and then resets strains before starting the test. This is all clearly described in the mmPkg memo.
Your model is working properly based on my observation of the snapshot above. The specified axial pressure of 10 MPa gets applied (by moving the platens together) and then the strain is reset to zero and the test commences. This is described in the following excerpt from the mmPkg memo.
Dear David,
Thank you very much for your continuous support. Please feel free to call me Alaa.
I am currently running the uniaxial compression test (UCS), and it seems to be working properly so far—it has been running for more than five days and is still ongoing.
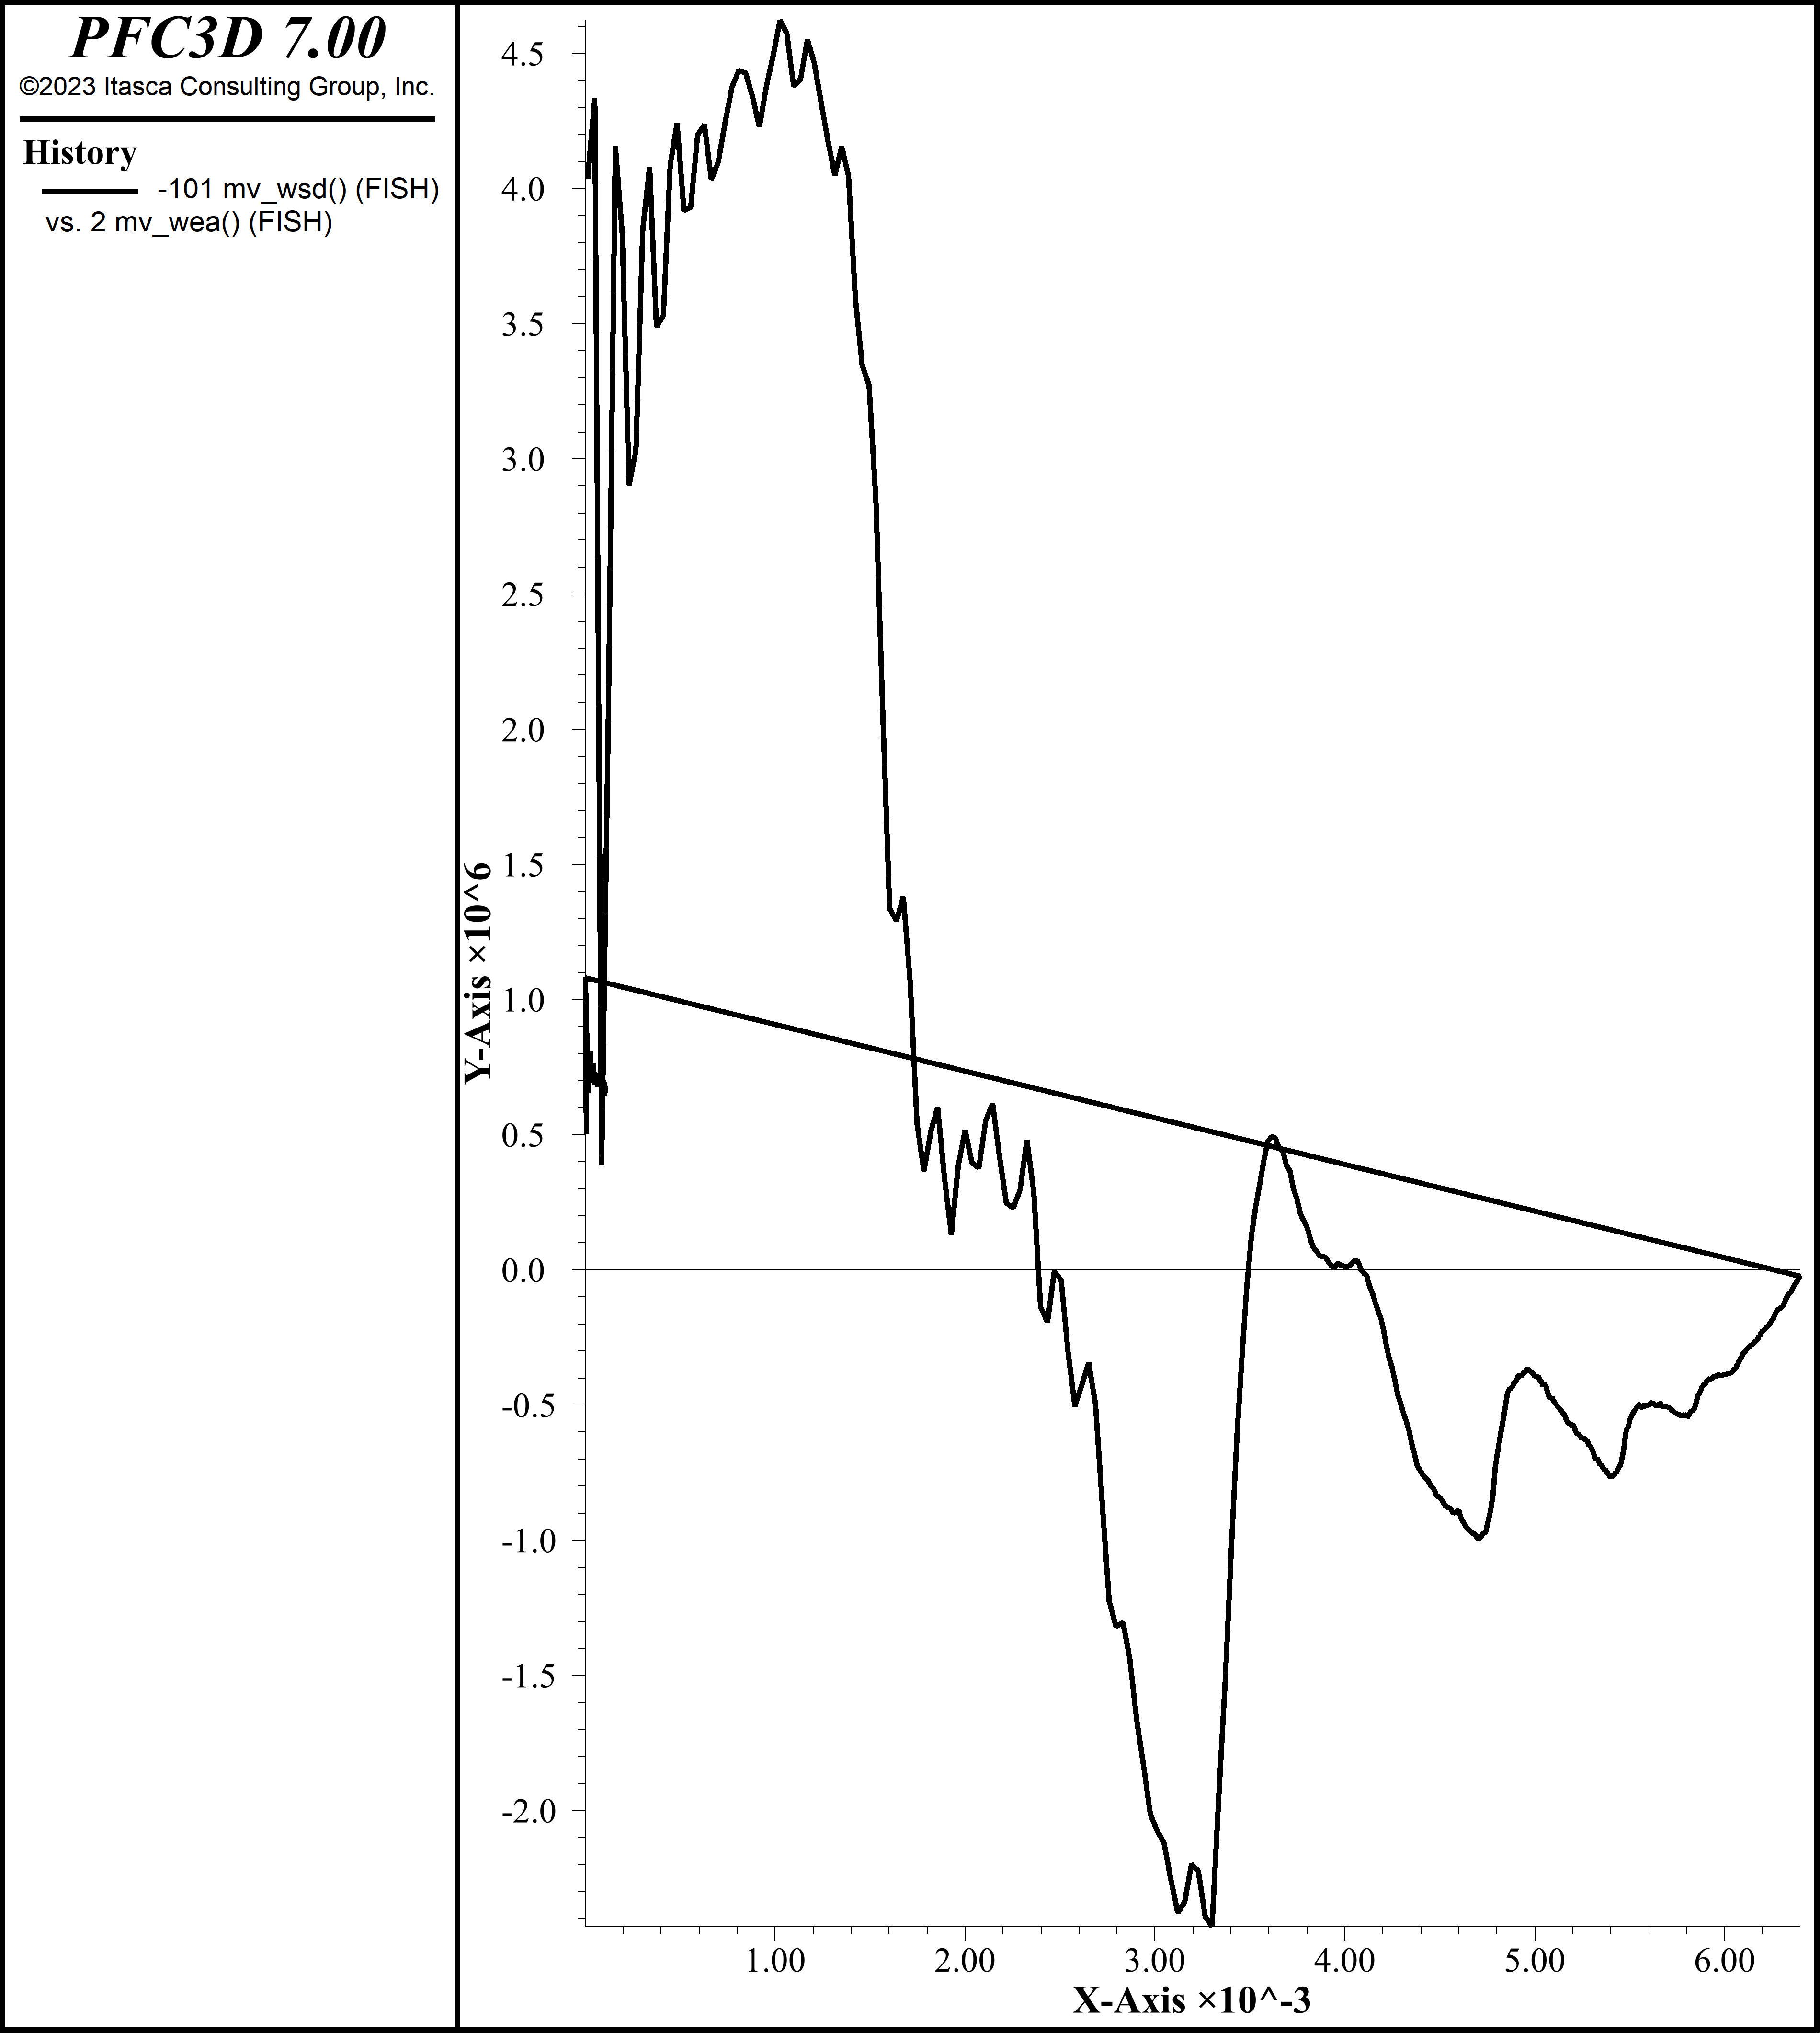
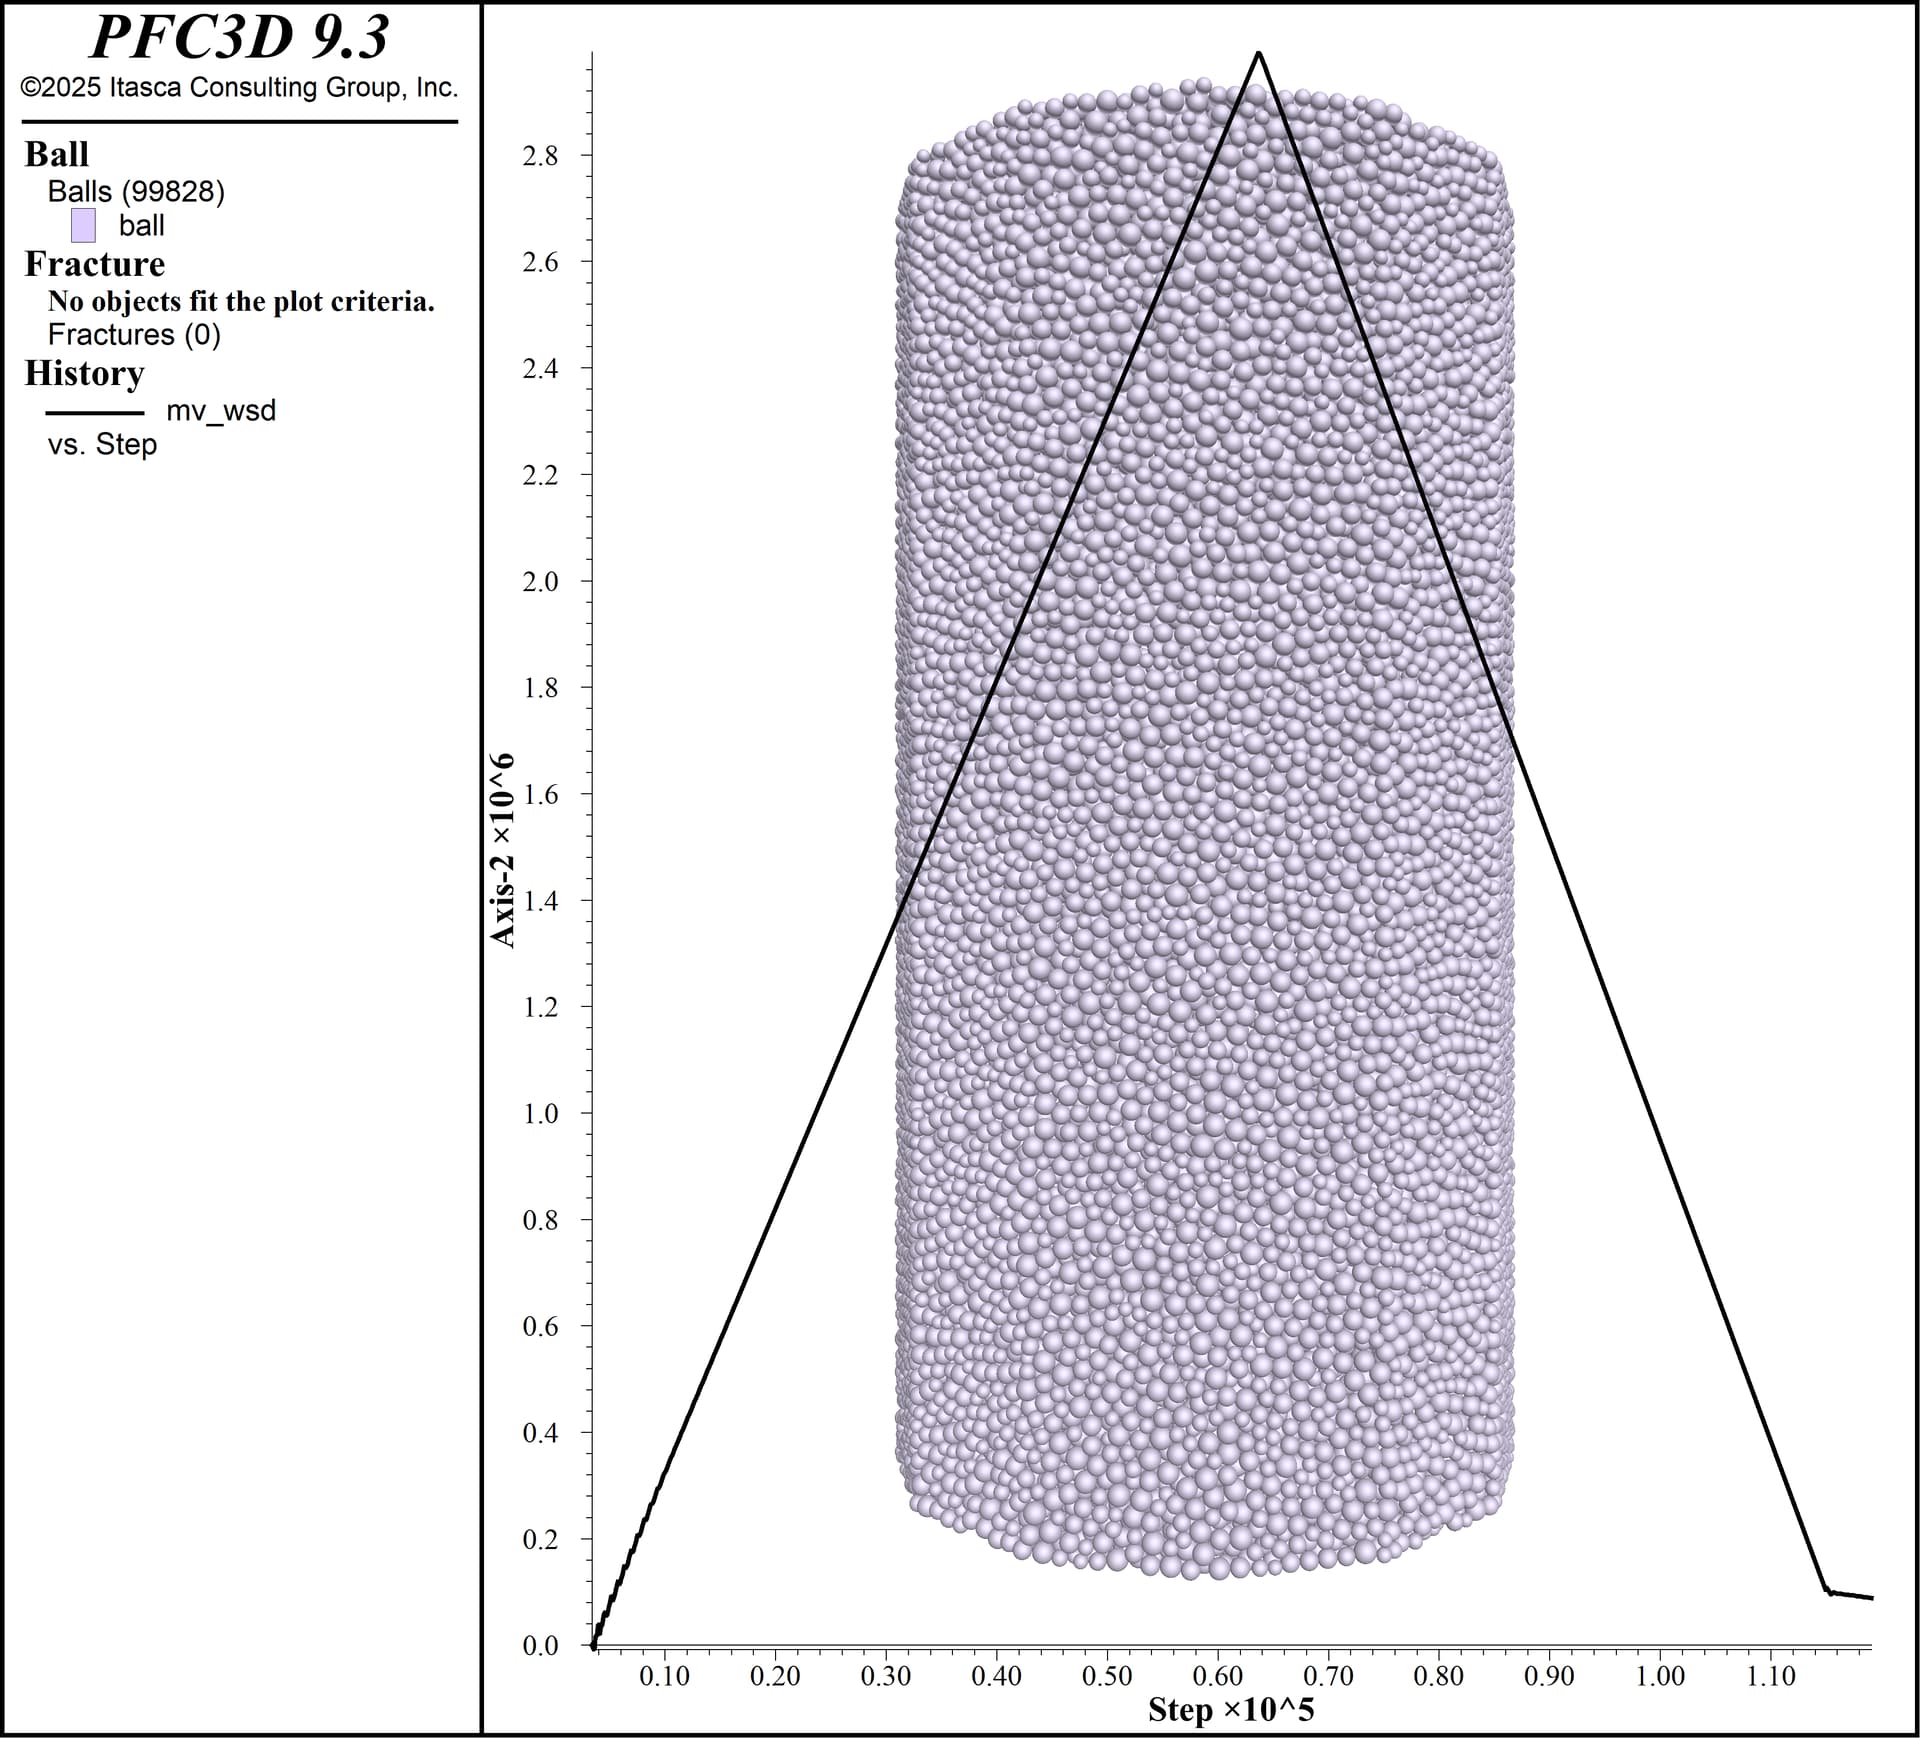
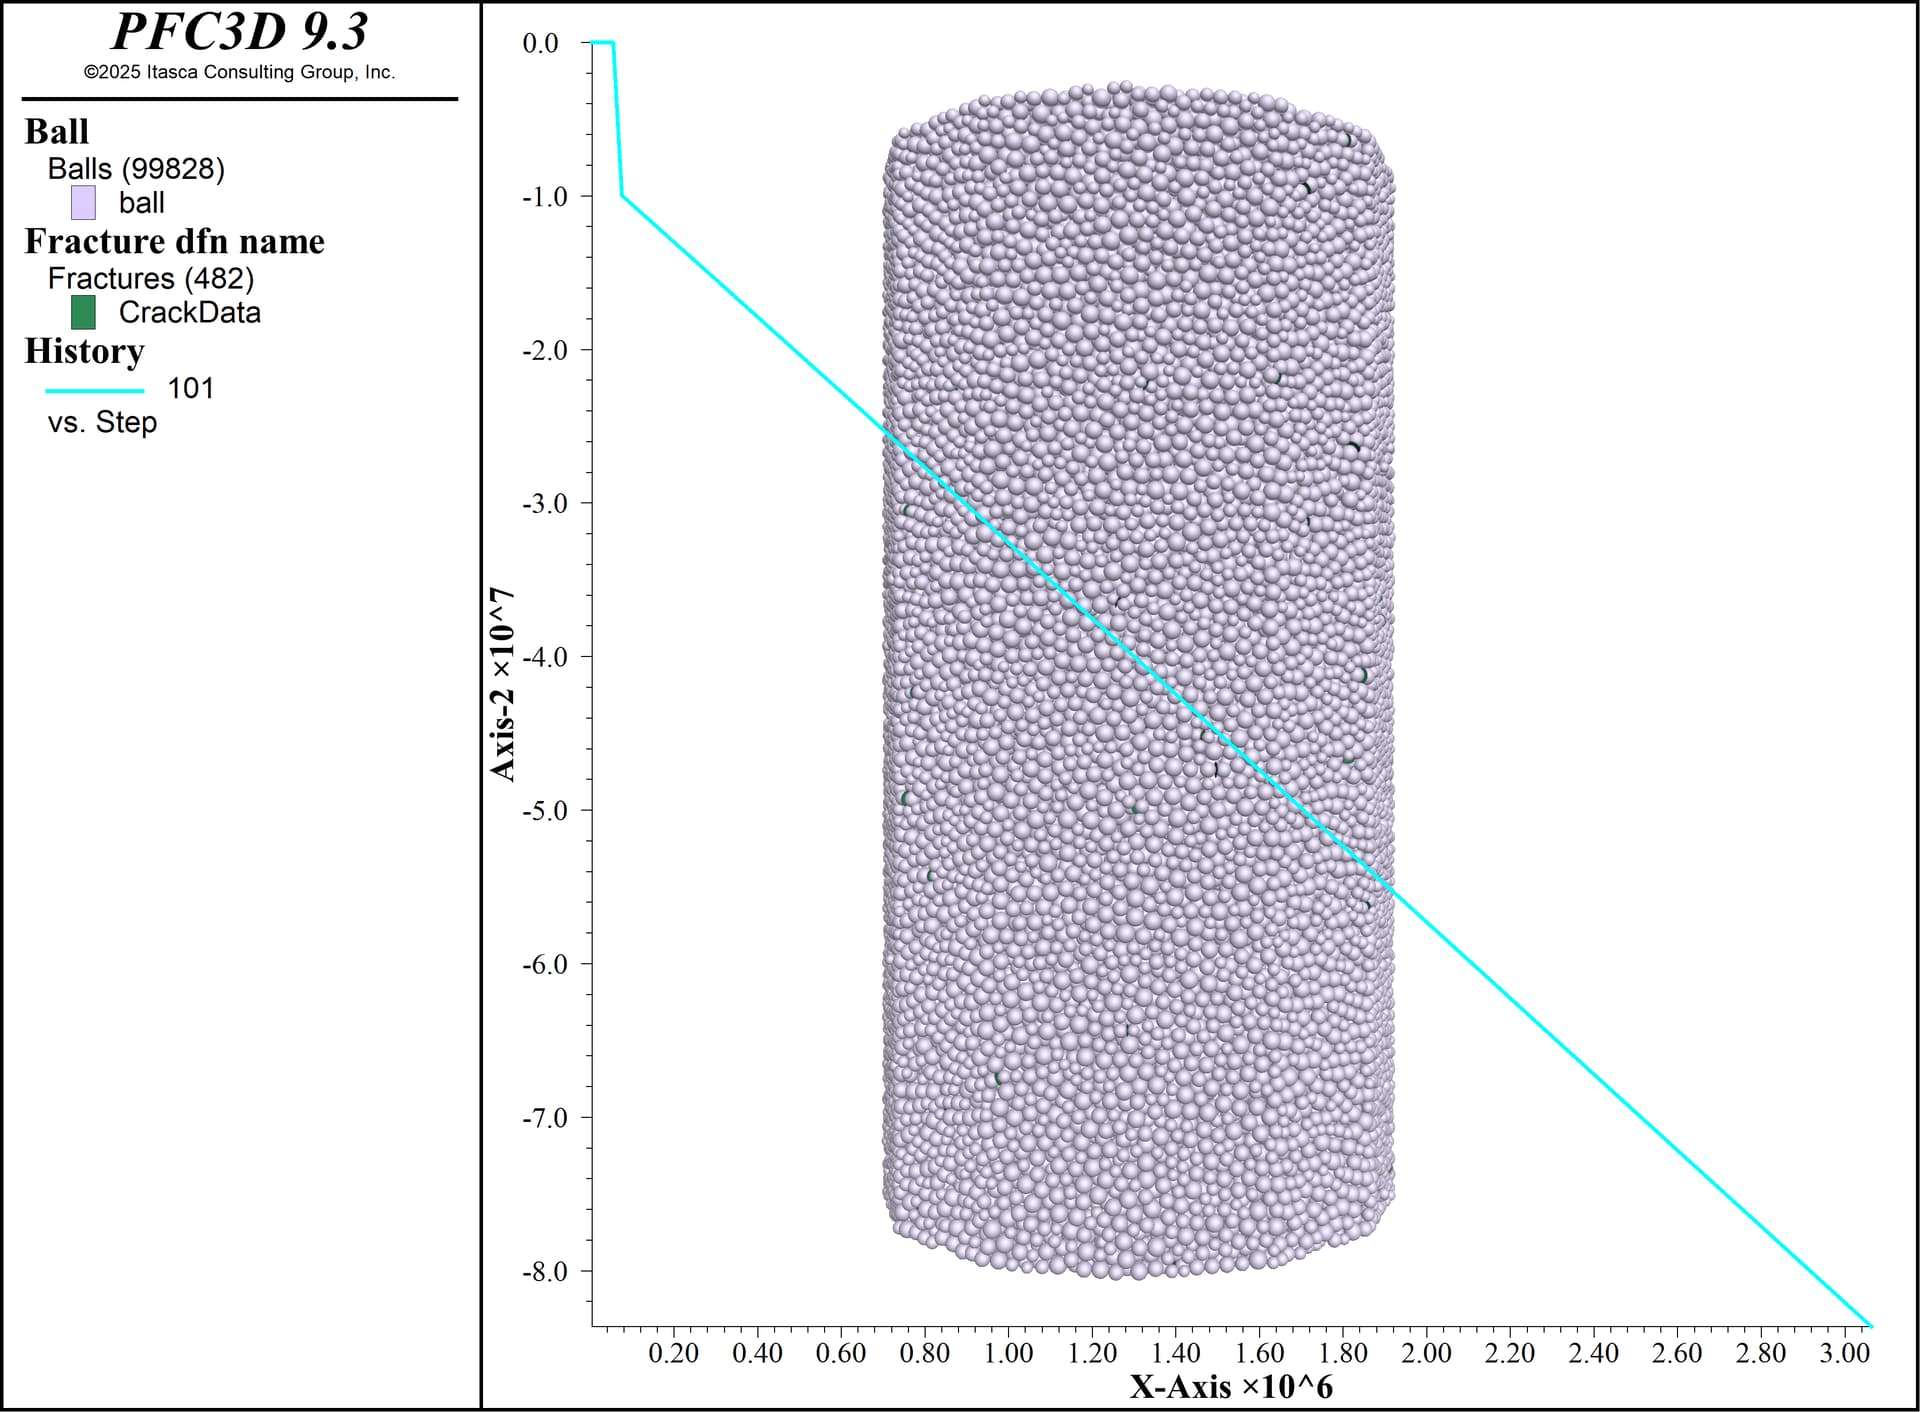
However, when I run the same codes for the 10 MPa case, I only change ct_testType = 0 and ct_Pc = 10.0e6 to switch to the triaxial compression test, but the stress–strain response does not appear correctly. I run the 10MPa test in parallel with the UCS.
I have attached two images showing the results, where the black curve corresponds to the 10 MPa case.
Could you kindly help me understand what might be going wrong? I am also checking the mmPkg memo for any hints and hope to resolve this soon.
Thank you again for your time and guidance.
Best regards,
Alaa